


21 Sep This essential chart explains why election night could last a month
We’ve all heard that this election year will be different. Millions of us will avoid going to the polls in the interest of our safety, so we’ll mail in absentee ballots instead. This will place an extra burden on the USPS, which has already seen hundreds of its automated sorting machines removed under the new postmaster general appointed by Donald Trump.

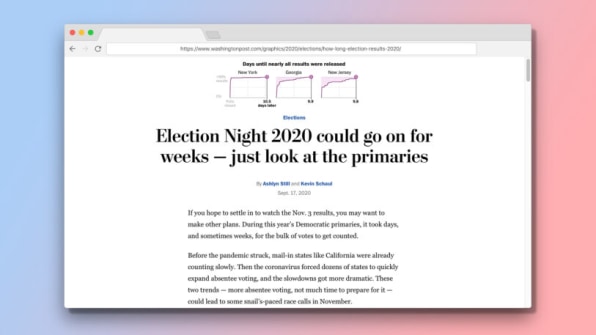
What this means is that counting ballots could take time. And in a series of graphics by The Washington Post, we get an idea of just how much time we’re talking about. The publication analyzed the speed of collecting and counting ballots from the Democratic primaries earlier this year. Some happened before quarantines started going into effect on March 17, some happened after. In both cases, we can see a lengthy lag between voting day and results—as long as 10.5 days, in the case of New York.
The charts depict the total percentage of ballots counted over time. Mail-in and in-person votes are piled in together. The filled block of color that you see represents uncounted votes. What you generally notice is that states whittle away at counting votes steadily over time, forming a ramp. But those final few percentage points can take days to both come in and then be counted, dulling its edge.
In states like New York, California, and New Jersey, which each took around 10 days to count primary votes (the max delay on the chart), this might not actually slow down an election verdict as long as you’d expect. Given that they’re all traditionally blue strongholds, it’s possible and even likely that we’ll see a strong enough statistical lead by Biden that the media will be able to call the states for Biden even if some votes aren’t yet counted. (Election results in California, for instance, generally need a month for full certification, but because the state goes overwhelmingly Democratic, it’s not an issue.)

More worrisome are three key battleground states that were also slow to report in the primaries: Pennsylvania, Wisconsin, and Georgia–which took six, six, and 10 days, respectively, to collect more than 99% of all votes. Slow battleground states could hold the election in balance. And it’s certainly not difficult to imagine a heavily taxed USPS slowing down these results more during the actual, presidential election, either.
What can we do with this information now that we have it? Mail in your vote as early as you can to help your state (and make sure you’ve requested an absentee ballot!). And then, steel yourself for an election night that may feel more like an election month. Delays don’t mean democracy is broken. On the contrary; when every vote counts, counting all those votes can take some time. And thanks to these charts, we can see that as plain as day.
Source: Fast Company
Sorry, the comment form is closed at this time.