


15 Nov Delta variant Thanksgiving map: the states that could be COVID hotspots on Turkey Day
Thanksgiving is just 10 days away. Many Americans will be wondering how widespread COVID-19 is where they’re going if they happen to be traveling to see relatives on Turkey Day. The good news is this year America seems to be in a much better place when it comes to Thanksgiving and the pandemic. Multiple vaccines are now available and easy to get – and they remain the best defense we have against covid for the upcoming holiday season.
Of course, traveling to see family over Thanksgiving still provides some risk, and that risk increases the more widespread COVID-19 is in the state being traveled to. That begs the question: which states are likely to have the highest levels of COVID-19 cases on Thanksgiving day?
That’s where the MayoClinic’s “Hot spots in the United States” COVID-19 map comes in. The map shows the rolling average for daily COVID-19 cases per state for the last 60 days. But using the slider, the map also forecasts the rate of COVID-19 cases up to 14 days out.

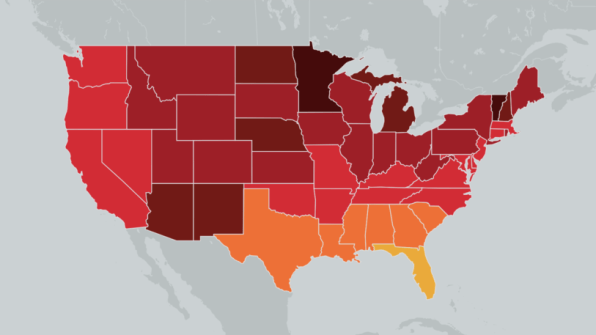
So what does the COVID-19 forecast look like for November 25, 2021 – Thanksgiving Day? The MayoClinic’s map color codes states different shades based on the forecasted cases per 100,000 people in the state’s population. Darker shades mean higher case numbers (bad) and lighter shades mean lower case numbers (good).
On Thanksgiving Day 2021, MayoClinic’s map forecasts that Minnesota and Vermont (both colored dark brown on the map) will have the worst caseloads per 100,000 people. Minnesota is forecast to have 90 cases per 100,000 people, while Vermont is expected to have 77 cases per 100,000. The state with the best caseload? Florida, colored yellow, which is forecast to have only 5 cases per 100,000 people.
The Southeast and south-central parts of the U.S. are all colored orange, which means those states are expected to have between 5 and 10 cases per 100,000 people. Any states colored red (California, Missouri, Virginia, etc) will have between 10 and 25 cases per 100,000 people. Maroon-colored states are expected to have between 25 and 50 cases per 100,000 people, and brown-colored states are expected to have between 50 and 75 cases per 100,000 people.
In other words, as most of America is shaded red or darker, COVID-19 caseloads on Thanksgiving Day 2021 are forecasted to be relatively high. As for what this means for your travel plans, the CDC has put together information on safe ways to celebrate the holidays here.
Source: Fast Company
Sorry, the comment form is closed at this time.